
If you’re going to exercise, you might as well do it in a way that really improves your fitness. But how do you know when you’re pushing hard enough? Internet fitness gurus push the concept of “zones,” and tell you to spend as much time as possible in “Zone 2.”
I spent a few weeks trying to measure my own Zone 2 as precisely as I could, instead of reading it off a formula. This week I’ll explain how — and why the most interesting thing I found wasn’t a number at all, but the fact that my Zone 2 moves.
The backstory: winded on the stairs, fine on the bike
About five years ago I noticed I was getting seriously winded doing simple things. Walking up to the second floor of our house left me panting. That, plus a year-over-year drop in my Apple Watch–measured VO₂ Max, sent me straight to a cardiologist and a battery of clinical-grade tests. The tests concluded two things: (1) the Apple Watch VO₂ Max was badly wrong — the lab put me more than 20 mL/kg/min higher than the watch claimed — and (2) my heart is fine.
What I have instead is exertional dyspnea: an apparently benign condition where my body just takes a little extra time to “warm up.” Climb the stairs cold and I’m out of breath. Go for a 30-mile bike ride and I’m fine. What gives?
Why I don’t trust the formula
The famous podcasters insist we all chase “Zone 2.” The idea is that effort divides into five intensity levels (that you measure based on heart rate) from 1 (barely distinguishable from rest) to 5 (you can’t hold it more than a few minutes). Zone 2 is supposed to be the sweet spot: enough to build aerobic fitness, not so much that it wears you out.
You can compute your zones from formulas based on age, sex, and resting and max heart rate. Google it or ask Claude and you’ll find various online calculators that, for me, give numbers from 117 to 140. But these formulas are averages, computed over zillions of people. But to a personal scientist, I’m not an average — I’m me. So what’s Zone 2 for me?

How I went about finding it
The right tool is a chest strap — a Polar H10 (see PSWeek260409) — not an Oura, not an Apple Watch. Wrist optical sensors are fine for a rough heart rate, but they smear the beat-to-beat timing, and the beat-to-beat timing is the whole game here.
After lots of back-and-forth with Claude, the method I settled on is DFA α1: a number computed from the tiny variations between consecutive heartbeats that falls in a predictable way as you work harder. When it drops through about 0.75, you’ve crossed your aerobic threshold — the top of Zone 2. It’s the closest thing to a lab lactate test, and unlike a formula, it’s measuring me.
At first I tried a ramp test at a professional fitness center: warm up, then step the treadmill up a notch every three minutes until you can’t hold a conversation, watching α1 fall as you go. Clean in theory. In practice it was a mess. My tests conducted over a couple of weeks gave me numbers all over the map.
So I ditched the treadmill for something that fits me better: a 30-minute neighborhood walk I already do most mornings. I live in a hilly area with a set route that has a couple of steep ups and downs. Instead of trusting the math alone, I added a second, independent instrument — my own breathing. I pressed a marker button the instant my breathing broke from nose-only into open-mouthed huffing, the oldest and most honest threshold signal there is. It landed at heart rate 140. Better yet, the α1 math agreed to within a couple of beats. Two completely different instruments, one answer.
The real finding: my Zone 2 moves
But the real surprise was learning that my threshold isn’t a fixed number — it depends on whether I’m warmed up.
Two climbs on the same hill, fourteen minutes apart, at the same heart rate of 133: on the first, cold out of the gate, I crossed threshold and my breathing broke; on the second, warmed up, I cruised comfortably below it. So I don’t really have one Zone 2 ceiling. I have a cold one around 136 and a warm one closer to 148 — call it a working aerobic ceiling of about 140 once I’m moving.
My zones — and why the standard formula mis-sorts me
Here are the numbers for me, built on a measured max of 182 and a resting rate of 57 (so a heart-rate reserve of 125):
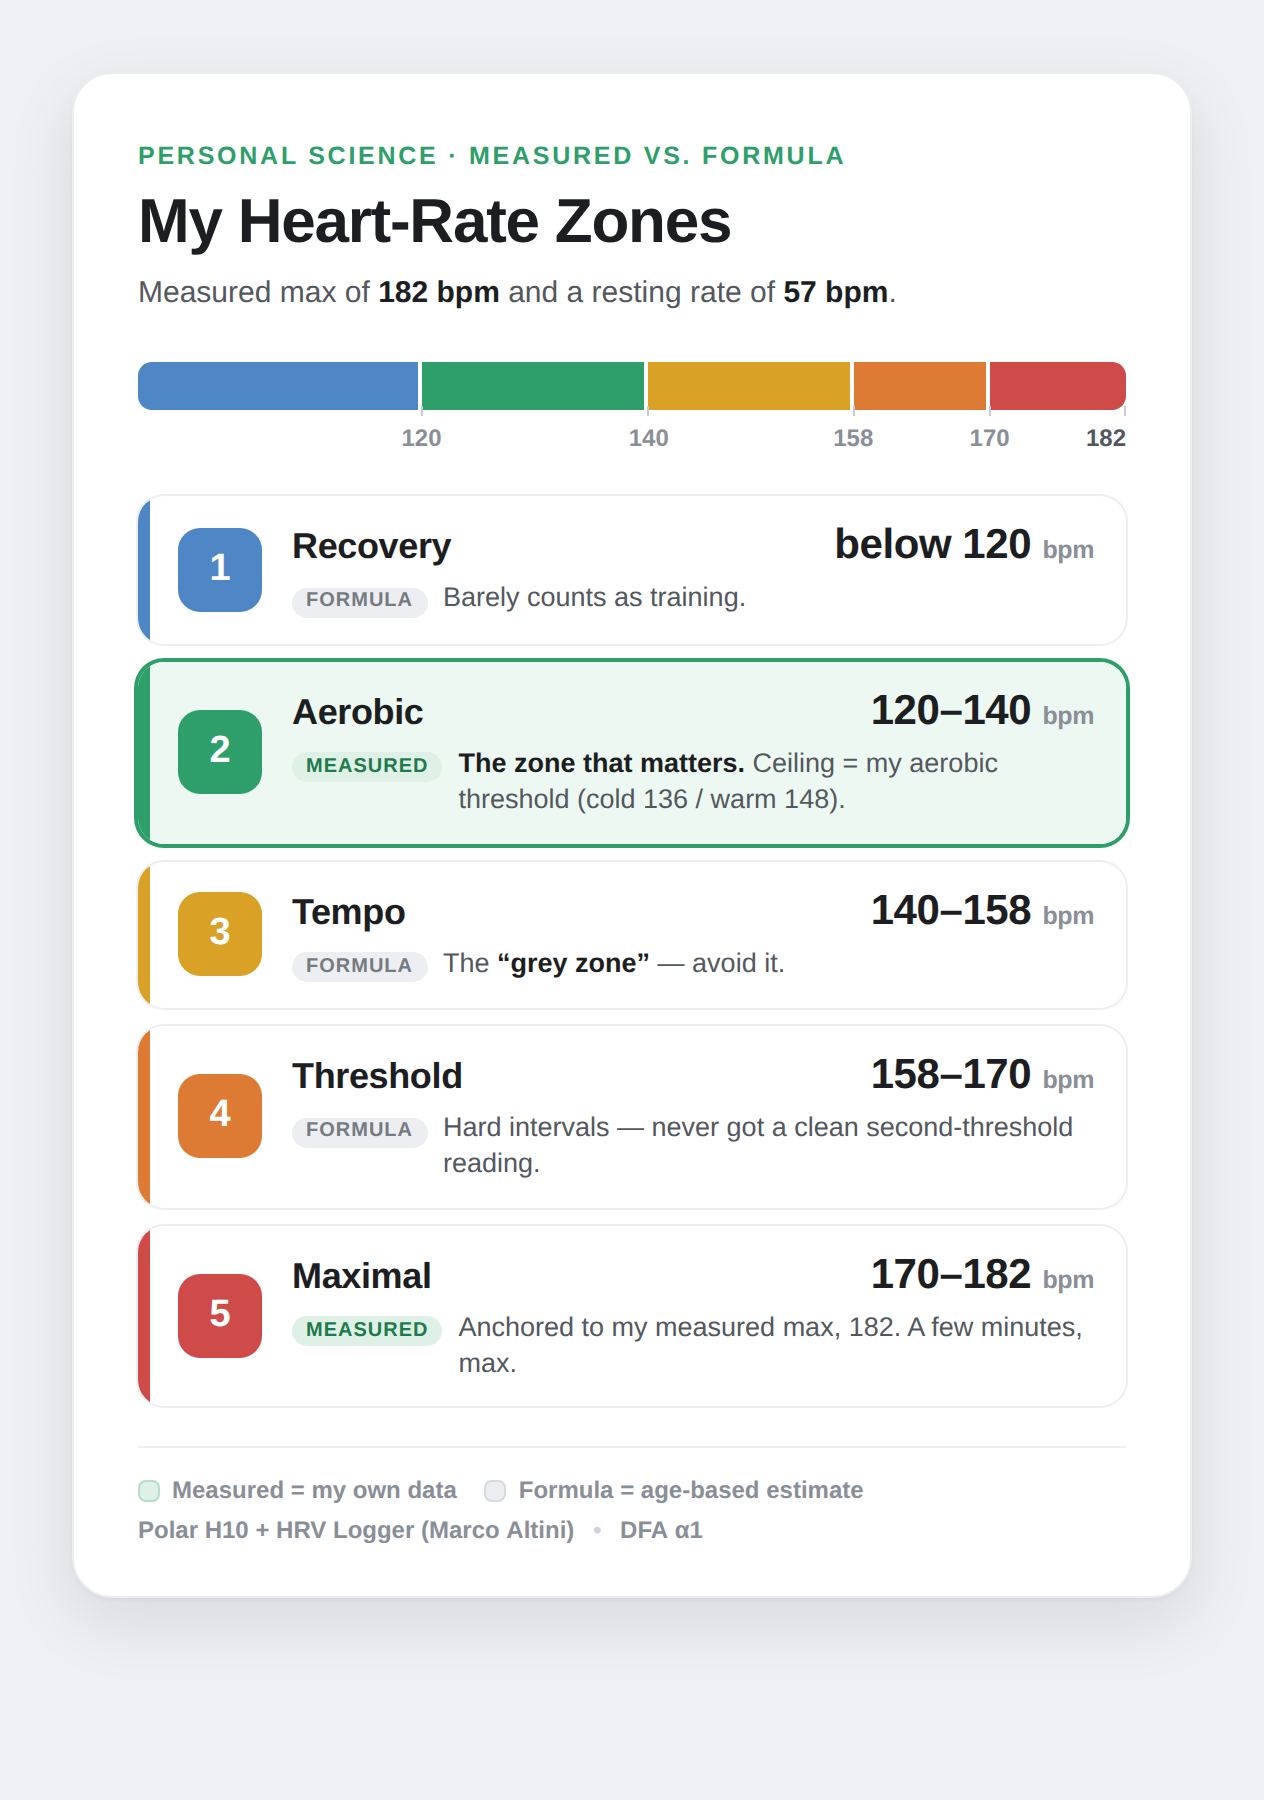
One interesting result if you want to use a zone calculator. The two most common formulas disagree wildly at the low end; the plain %-of-max-HR model would cap my Zone 2 at about 127 — thirteen beats too low. But the heart-rate-reserve (Karvonen) model puts it at 145 — within five beats of my measured 140. For me, at least, reserve-based zones track the physiology and percent-of-max doesn’t. If you’re going to use a formula, use Karvonen.
So what about my dyspnea?
Finding my zones ended up explaining it.
My dyspnea is a transition problem, not a capacity problem. The mechanism is slow VO₂ on-kinetics: at a rest-to-hard transition, oxygen delivery lags demand, the gap gets covered anaerobically, ventilatory drive spikes, and I feel winded — at a low heart rate, because my heart rate hasn’t caught up yet. Once I’m warmed up, the same load is comfortably aerobic. That’s why the stairs get me but I barely noticed the 2-hour-39-minute bike ride I did last weekend.
So the prescription is easy: deliberate sub-threshold surges. From easy up to about 140 for two or three minutes, back down, repeat — staying under my conversational ceiling (call it ~145) the whole time. It’s the same intensity I already ride at, just no longer smooth about getting there.
Best of all, I finally have the dyspnea as a number. My cold-to-warm gap was about 8 beats. If my on-kinetics improve with training, that gap should shrink. Now, that said, 8 beats is close to the run-to-run noise of a chest-strap threshold estimate, so before I can claim the gap is closing I need to log it across several mornings and watch the average move. But that’s the whole point of measuring anything — turning a vague “I get winded on the stairs” into a quantity I can actually track.
Personal Science Weekly Readings
Quantified Self co-founder and OG, Gary Wolf has a new substack. Drop everything you’re doing and subscribe! While you’re at it, please pre-order his new book: The Quantified Self: Learning to Observe.

Speaking of learning to observe, The Cosimo Research Journal of Non-Institutional Science publishes numerous interesting, if eclectic, crowd-sourced studies, worth reading, on subjects like Does Mouth Taping Improve Sleep (tldr; no)
Personal scientists keep saying that everyone is unique, but now Uri Bram has an online tool that lets you be more quantitative about it. For example, if you have a bachelor’s degree or higher, have children, and both your parents were born in the US: only 16% of Americans fit that description. Calculators like this are becoming easier to create thanks to Claude, so expect a zillion more in the future.
About Personal Science
Be open-minded, be skeptical: those are some of the tenets to remember if you want to use science in your personal life. We publish ideas and thoughts each Thursday, but if you have more topics you’d like to discuss, let us know.
Endurance athletes figured out that doing about 80% of their training at low-to-moderate intensity and just 20% above is optimal for winning races, but it varies depending on the sport, the athlete, and the training phase. Not sure why you'd want to limit yourself to low-intensity exercise, especially if you aren't training all day every day...