Personal Science Week 250619 - Normal
Population averages don't apply to you
Medical “normal” ranges are often useless for individuals. Your fever might start at 99°F while your friend’s doesn't kick in until 101°F.
This fundamental problem with population-based medicine is exactly why personal science matters—and why knowing your own baseline is more valuable than any textbook range.
What’s Normal?
Walk into any doctor's office and they'll check your vital signs against standardized ranges that haven't changed much in decades. Temperature over 100.4°F? You have a fever. Heart rate above 100 beats per minute? That's tachycardia. Respiratory rate over 20 breaths per minute? Abnormal.
But here's the problem: these population averages tell you almost nothing about what's normal for you as an individual. Scripps researchers writing in The Lancet summarize the problem:
what is actually a person's 'normal' varies substantially between individuals. For oral temperature, that range falls between 35·7°C and 37·4°C, respiratory rate between 12 and 20 breaths per min, and resting pulse rate between 40 and 109 beats per min.
That's a massive range—nearly 4 degrees Fahrenheit for temperature alone.
Even more importantly, “individuals experience daily, weekly, and seasonal fluctuations unique to them in a range of physiological parameters and activities. Only by knowing what is normal for an individual when they are well is it possible to identify the earliest possible deviations from that normal.”
The Temperature Myth
Let's start with the most basic vital sign. “Normal” body temperature is 98.6°F, right? Wrong.
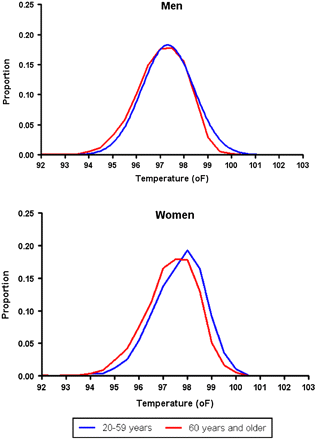
That number comes from a German physician who measured 25,000 people in the 1860s. But modern studies show only 8% of healthy volunteers actually have a body temperature of exactly 98.6°F. A large 2011 study also showed significant differences corresponding with age, particularly among women.

Time of day matters too, with Boston Children's Hospital scientists finding almost one Fahrenheit degree of difference throughout the day in healthy people. Your morning temperature and evening temperature can differ by nearly a full degree, even when you're perfectly healthy.
Beyond Temperature: Your Personal Baselines
The same principle applies to every measurable aspect of your health. Consider the simple sit-to-stand test: count how many times you can rise from a chair in 30 seconds. The CDC provides population averages by age:
60-64: average 14 for men, 12 for women
70-74: average 12 for men, 10 for women
80-84: average 10 for men, 9 for women
But what if you're a 65-year-old woman who can do 18? Or a 70-year-old man who struggles to hit 8? The population average tells you nothing about your personal trajectory or whether a change represents improvement or decline.
Even “Normal” Changes Over Time
Here's something that might surprise you: what we consider “normal” keeps shifting. The 1958 AMA charts for “ideal weight” look dramatically different from today's standards. A 5'6" man with a "medium frame" was supposed to weigh 142-151 pounds in 1958. Try finding a doctor today who'd call that anything but underweight.

Are we healthier now, or were people healthier then? The answer probably depends on which metrics you care about—and that's exactly the point. Population “normals” reflect the population being measured, not some universal truth about optimal health.
The Personal Science Solution
Personal scientists have a huge advantage here: we can track our own baselines over time. Instead of worrying whether your resting heart rate of 52 BPM is "normal" (it's at the low end of that 40-109 range), track how it changes with your sleep, stress, exercise, and diet.
A few practical suggestions:
Start simple: Pick 2-3 metrics you can measure consistently. Temperature first thing in the morning, resting heart rate, or something like the sit-to-stand test.
Track patterns, not single points: One high reading means nothing. A consistent upward trend over weeks means everything.
Note your context: Track when you're healthy, stressed, traveling, sick. Your personal patterns will emerge quickly.
Don't ignore the ranges entirely: Population normals exist for a reason. If your metrics fall way outside established ranges, that's worth investigating—but the investigation should start with understanding your personal patterns.
More Reading for Personal Scientists
The grip strength test is another simple baseline worth tracking. Research suggests it's one of the best predictors of longevity, and you can measure it at home with a simple dynamometer.
FeverPrints was a fascinating project that collected temperature data via iPhone app, revealing just how much individual variation exists in something as "simple" as body temperature.
We've written before about other fitness calculators and comparisons that can help you understand where you stand relative to others your age and sex—but remember, those are starting points for understanding yourself, not final judgments.
About Personal Science
Personal scientists know that you are not an average. We use the tools of science—careful measurement, skeptical analysis, controlled experiments—to understand our own unique patterns and optimize our own outcomes.
Most medical advice is based on population studies of people who aren't you. Personal science lets you be your own control group, your own experimental subject, and your own case study.
We publish this newsletter every Thursday for anyone who wants to apply scientific thinking to personal questions. If you have other topics you'd like us to explore, let us know.

"Normal" is a good starting point, treat it as a Bayesian prior.
Thank you, Richard. Your newsletter always gets me thinking on a Thursday morning.