
Personal Science Week - 21-Jul-2022
Aging clocks compared
Most consumer-focused diagnostic products are really just about telling you how healthy you are. Many of us want a single number — a health score — that we can track to tell whether some intervention is working.
One health score that seems useful is biological age. We know your chronological age, but wouldn’t it be nice to know whether your body is aging faster or slower than the number you celebrate each birthday?
Several potential clocks have been proposed, many of which are for sale at consumer prices. But how well do they compare? A study led by a University of Edinburgh researcher attempts an answer.
They ran 15 different bioage clocks on 1000 people and found that they all do reasonably well at predicting chronological age. But when looking at the differences among them, how much is due to some unique aspect of the test and how much is from getting at a special aspect of biology that the others don’t measure?
In this chart, the large number of dark reds hints that the tests are largely measuring the same underlying something.
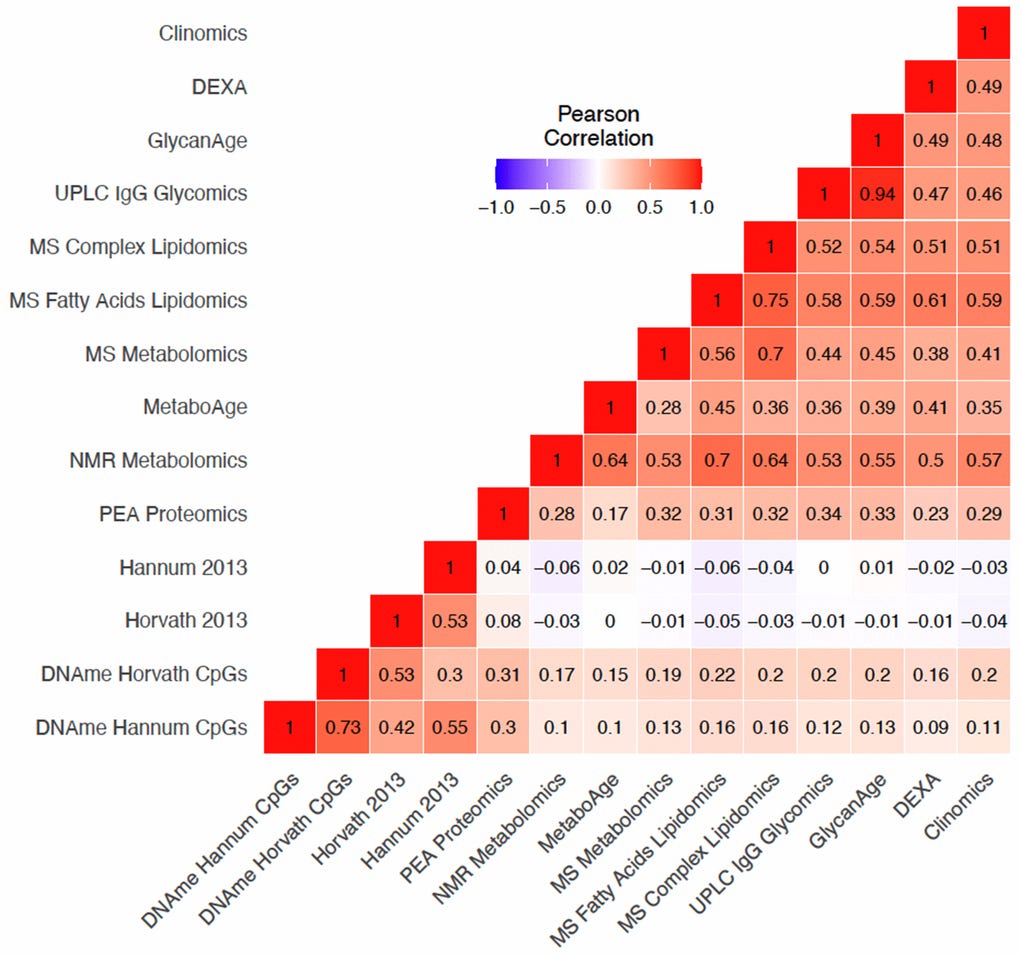
and here, dark blues show how much overlap exists between the variance they each explain in chronAge. In other words, they seem to be looking largely at the same thing, whatever it is.
 so that a value of 1 means that the second clock is adding no more information than the first, meaning that they overlap entirely in the information they provide about chronAge. A value of 0 would indicate the observed variance explained in chronAge is exactly what is expected if the two clocks were independently sampling. Negative values indicate disproportionately complementary components of chronAge were being tracked.")
Intuitively, a higher bioAge should express a higher number of pathologies. People who are sick, you’d think, tend to die earlier.
That’s kind of what you see here. The redder the square, the higher a bio age was predicted by that test.
Similarly:

Bottom line: these are early days, and just about any test is about as good as another.
About Personal Science
Listen to experts, but be skeptical. That’s the idea behind Personal Science, where we use the techniques of science to solve personal problems, rather than as part of a job.
Follow us to learn as we learn: